Actively Managed Equity
 Overview: All Strategies
 Investor Resources
 Indexed Equity
 Private Equity
 Digital Assets
 Invest In The Future Today
 Take Advantage Of Market Inefficiencies
 Make The World A Better Place
 Articles
 Podcasts
 White Papers
 Newsletters
 Videos
 Big Ideas 2024
ARK’s Expected Value For Zoom Video Communications In 2026: $1,500 Per Share


The information presented reflects the views and assumptions of the authors at the time of publication. Please note that this research is at least one year old and the authors’ current views may materially differ from those presented without notice. The results will not be updated as ARK’s internal models change, or any information upon which ARK relies upon changes.
According to ARK’s open-source research and model, Zoom’s share price could approach $1,500, compounding at a 76% annual growth rate, in 2026.[1]
Tuned to the 75th and 25th percentile Monte Carlo outcomes, our bull and bear cases are $2,000 and $700 per share, respectively, as shown below.[2]
As with our open-source Tesla model, we are publishing our open-source Zoom model to strengthen the quality of our research. By sharing our assumptions and modeling methodologies, we hope to solicit constructive feedback and criticism. As with open-source software, we believe that open-source research will prove to be more robust and accurate than research conducted non-transparently behind closed doors.[3]
Zoom Price Targets: Expected (Base), Bear, and Bull Cases Per Share
| ARK’s Simulation Outputs | ARK’s 2026 Price Estimate (Per Share) | Significance |
|---|---|---|
| Expected Value | $1,500 | This projection is our expected value for Zoom’s share price in 2026 based on our Monte Carlo analysis. |
| Bear Case | $700 | We believe that there is a 25% probability that Zoom could be worth $700 per share or less in 2026. |
| Bull Case | $2,000 | We believe that there is a 25% probability that Zoom could be worth $2,000 per share or more in 2026. |
Source: ARK Investment Management LLC, 2022
For the benefit of readers, this article presents “expected value” (or “base case”), “bear case,” and “bull case” as a way of contextualizing the meaning of our 2026 share price expectations. Methodologically, we arrive at our base-case share price by averaging ten thousand simulations produced by our Monte Carlo model. Our bear and bull cases are the 25th and 75th percentile values, respectively. Forecasts are inherently limited and cannot be relied upon as a basis for making an investment decision and are built on our modeling that reflect our biases and long-term positive view of the company. Please see additional disclosures below on forecasts and hypothetical performance. For informational purposes only and should not be considered investment advice, or a recommendation to buy, sell, or hold any particular security.
This research extends our 2021 analysis of Zoom’s potential total addressable market opportunity. In this article, we detail our open-source model that presents possible outcomes for Zoom’s business over the next five years.
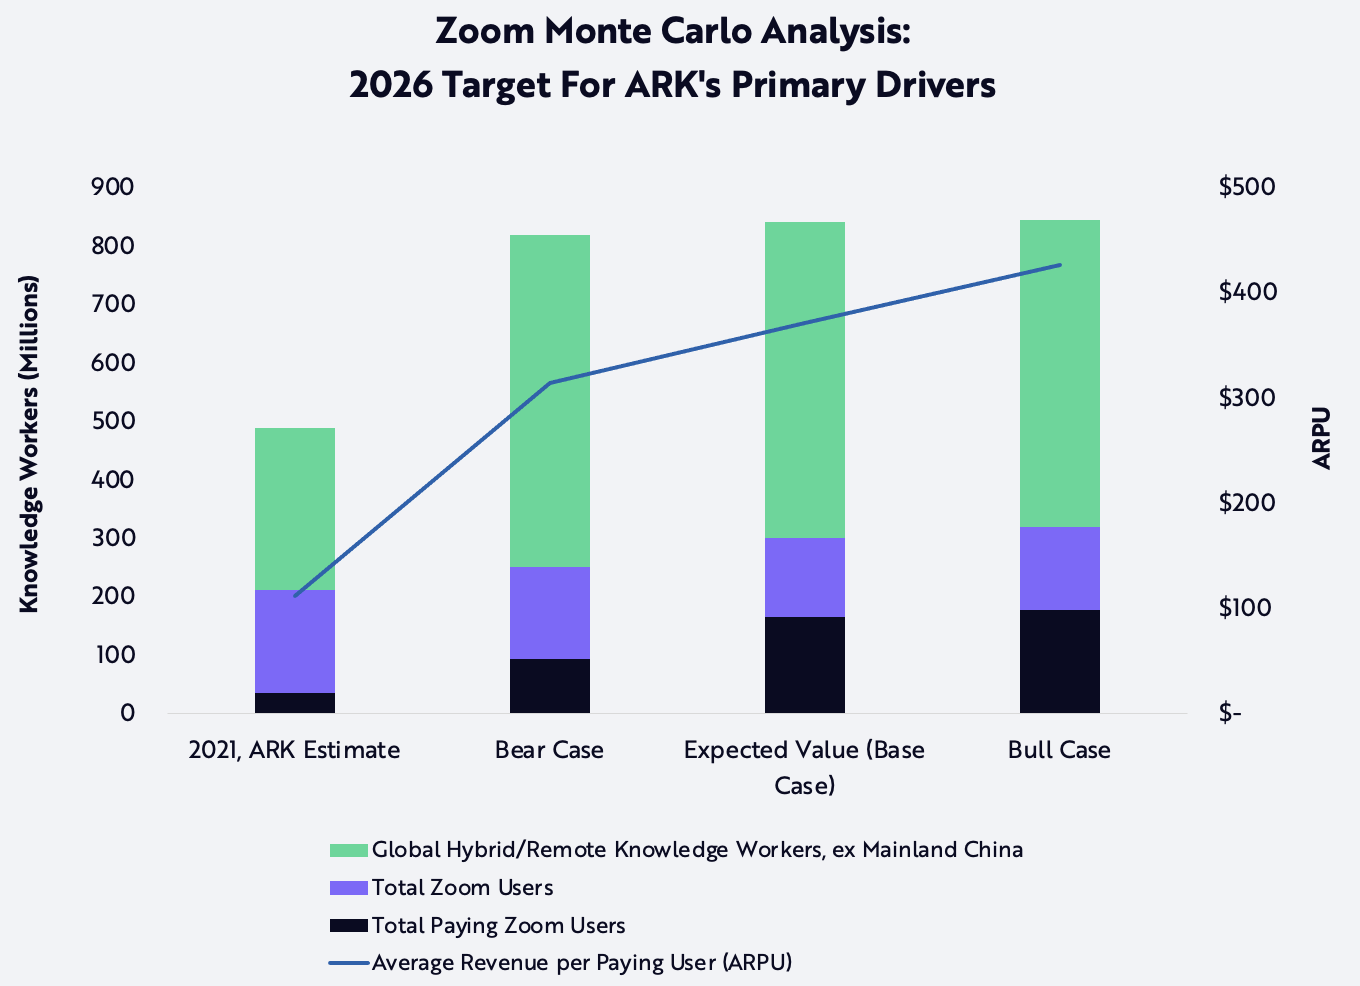
ARK’s open-source Zoom model simulates eight independent inputs to forecast a range of price targets. In our view, four of those inputs are the most important drivers for the business, as shown in the corresponding colors below.
Source: ARK Investment Management LLC, 2022
Forecasts are inherently limited and cannot be relied upon as a basis for making an investment decision and are built on our modeling that reflect our biases and long-term positive view of the company. Please see additional disclosures below on forecasts and hypothetical performance. For informational purposes only and should not be considered investment advice, or a recommendation to buy, sell, or hold any particular security. Note: For each case noted above, we average the inputs that correspond to the specified price targets within a one percentage point deviation. For example, our Monte Carlo simulations yield a bear case price target of $700 per share. We average all specified outputs in the above chart across all Monte Carlo iterations that produce a price target that is greater than or equal to $700 * 0.99 and less than or equal to $700 * 1.01.
In this article, ARK outlines four topics relevant to Zoom’s valuation as well as the risks and limits of our assumptions, below:
- Example Bear And Bull Outcomes
- Key Model Assumptions
- Model Assumptions That Are Not Key Drivers Of Our Zoom Price Estimates
- Business Opportunities Not Included In The Model
Example Bear and Bull Outcomes
We do not provide a single bull or bear case because we dimension the bull and bear outcomes as the 75th and 25th percentile output from ten thousand simulations. Nonetheless, the table below presents what we believe are good examples of each.[4]
| Example Output [*] | 2021 Actual [**] / ARK Estimates | Example Bear Outcome 2026 | Example Bull Outcome 2026 |
|---|---|---|---|
| Global Knowledge Workers with a Hybrid/Remote Working Model [***] | 489M | 820M | 850M |
| Global Hybrid/Remote Knowledge Workers Using Zoom | 212M | 250M | 320M |
| Paying Zoom Users | 36M | 90M | 180M |
| ARPU [****] | $113 | $310 | $430 |
| Total Revenue (Billions) | $4 | $30 | $70 |
| Adjusted Gross Margin [*****] | 71% | 87% | 89% |
| Adjusted EBITDA Margin [******] | 38% | 42% | 46% |
| Unlevered Free Cash Flow Margin | 35% | 25% | 27% |
| Enterprise Value / EBITDA | 24x [*******] | 20x | 20x |
| Market Cap (Billions) | $32 [********] | $240 | $680 |
| Share Price and CAGR | $108 [*********] | $700 (49%) | $2,000 (87%) |
Source: ARK Investment Management LLC, 2022
In the table above, we share the average outputs of all scenarios from our ten thousand simulations that correspond to the 25th and 75th percentile share price within a one percentage point deviation. Please note, however, that there are multiple discrete outcomes within our ten thousand simulations that could correspond to the bull and bear price targets. Forecasts are inherently limited and cannot be relied upon as a basis for making an investment decision and are built on our modeling that reflect our biases and long-term positive view of the company. Please see additional disclosures below on forecasts and hypothetical performance. For informational purposes only and should not be considered investment advice, or a recommendation to buy, sell, or hold any particular security. *Note: With the exception of results and estimates for the 2021 calendar year, all percentages and multiples are rounded to the displayed second digit for simplicity and are consistent with reasonable variance in the forecast. All other figures are rounded to the displayed first digit. **Note: The actual results of Zoom’s operations in 2021 correspond to results as of the end of their 2022 fiscal year. The first four lines of outputs within this column are ARK’s own estimates. ***Note: Our historical estimates and forecasts for global knowledge workers excludes knowledge workers residing in mainland China. ****Note: We define ARPU as the average revenue per paying user, or, put differently, the average annual spending per knowledge worker who pays to use Zoom. Please note that this definition of ARPU excludes knowledge workers who do not pay to use Zoom. *****Note: We assess historical gross margins after adding back cost-of-goods sold (COGS)-related stock-based compensation expenses to reported GAAP gross profit. ******Note: We assess historical EBITDA margins after adding back operations-related stock-based compensation expenses to reported GAAP operating profit, plus reported GAAP depreciation and amortization. *******Note: Earnings before interest, taxes, depreciation, and amortization (EBITDA). Current EV / EBITDA is as of June 1, 2022, at market close. ********Note: Current market capitalization is as of June 1, 2022, at market close. *********Note: Compound Annual Growth Rate (CAGR). Current share price is as of June 1, 2022, at market close.
Key Model Inputs
The following table presents key inputs to our forecast along with the upside and downside range of expectations.
| Key Model Input Ranges [*] | 2021 ARK Estimates | Downside (-1 standard deviation) | Upside (+1 standard deviation) |
|---|---|---|---|
| % Adoption of Hybrid/Remote Working Models by Global Knowledge Workers (excluding Mainland China) [**] | 51% | 60% | 90% |
| Zoom’s Share of Hybrid/Remote Knowledge Workers [***] | 43% | 20% | 50% |
| Zoom’s Monetization Rate [****] | 17% | 20% | 80% |
| ARPU | $113 | $188 | $532 |
Source: ARK Investment Management LLC, 2022
Forecasts are inherently limited and cannot be relied upon as a basis for making an investment decision and are built on our modeling that reflect our biases and long-term positive view of the company. Please see additional disclosures below on forecasts and hypothetical performance. For informational purposes only and should not be considered investment advice, or a recommendation to buy, sell, or hold any particular security. *Note: To specify the distributions of inputs across our Monte Carlo simulations, we define the “downside,” “downside case,” or “downside projection” for any given input as our forecast for one standard deviation below our forecasted mean. Similarly, we define the “upside,” “upside case,” or “upside projection” for any given input as our forecast for one standard deviation above our forecasted mean. Henceforth, we define the forecasted mean for any given input in our Monte Carlo simulations as the “mean projection.” **Note: This input refers to our forecast of total knowledge workers in a hybrid or fully remote working arrangement divided by our forecast of total knowledge workers globally. Note that, for the purposes of modeling Zoom’s business opportunity, both terms exclude knowledge workers residing in mainland China. ***Note: This input refers to our forecast of total Zoom users as a percentage of the first input, or total addressable knowledge workers in hybrid or fully remote working arrangements, excluding knowledge workers residing in mainland China. **** Note: We define Zoom’s monetization rate as our forecast for the number of paying users of Zoom divided by total Zoom users.
Adoption of Hybrid/Remote Working Models
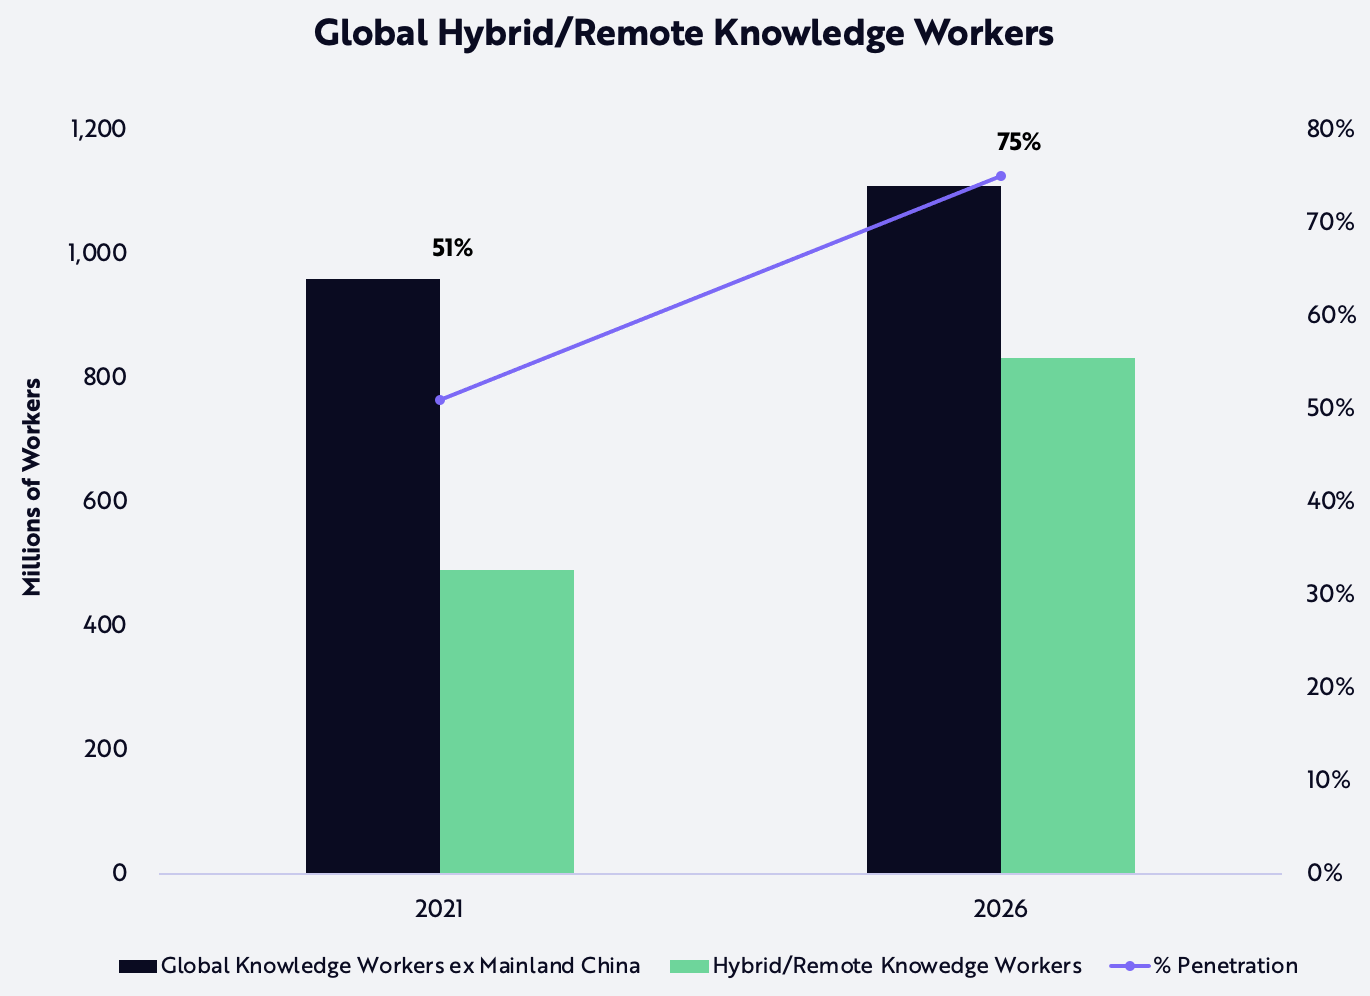
In June 2021, Gartner projected that 51% of knowledge workers worldwide would adopt either a hybrid or a fully remote working model by the end of that year.[5] By January 2022, Slack estimated that approximately 58% and 12% of all global knowledge workers worked in hybrid or fully remote arrangements, respectively, while ~30% worked in a business office outside of the home every day.[6] Although a perceived decline in the severity of Covid influenced many firms to reopen offices and reinstate 100% in-office mandates, which lowered the penetration of hybrid/ remote working models to 66%, we believe that knowledge worker backlash and talent shortages will compel employers to adopt more flexible arrangements.[7] Slack reports that employees forced to return to the office full-time experienced the steepest declines in work-life balance and overall satisfaction compared to their hybrid/remote peers, suggesting that in-office mandates will lead to high rates of attrition.[8]
We believe current pivots back to in-office mandates could be part of a trial-and-error process for employers that will increase the percent of workers in hybrid/remote working models during the next five years. In our mean projection, we expect 75% of all global knowledge workers to participate in such arrangements, up from 51% in 2021. Excluding knowledge workers from mainland China, we estimate that the addressable number of knowledge workers will grow 11% at a compound annual rate, from 489 million in 2021 to 832 million in 2026, as shown below.[9]
Source: ARK Investment Management LLC, 2022
Forecasts are inherently limited and cannot be relied upon as a basis for making an investment decision and are built on our modeling that reflect our biases and long-term positive view of the company. Please see additional disclosures below on forecasts and hypothetical performance. For informational purposes only and should not be considered investment advice, or a recommendation to buy, sell, or hold any particular security.
Zoom’s Video Communications Traffic Share
To estimate Zoom’s market share of addressable knowledge workers with a hybrid/remote working model, we exclude those located in mainland China and use Zoom’s historical market share of total video conferencing domain traffic on desktops, not “in-app” activity. According to Similarweb, Zoom’s market share dropped from 52% in 2019 to 48% in 2021, suggesting that increasing competition from other collaboration and communication suite providers could limit Zoom’s future penetration of global knowledge worker activity.[10] That said, we expect the company to remain a dominant provider of cloud-based communications during the next five years.
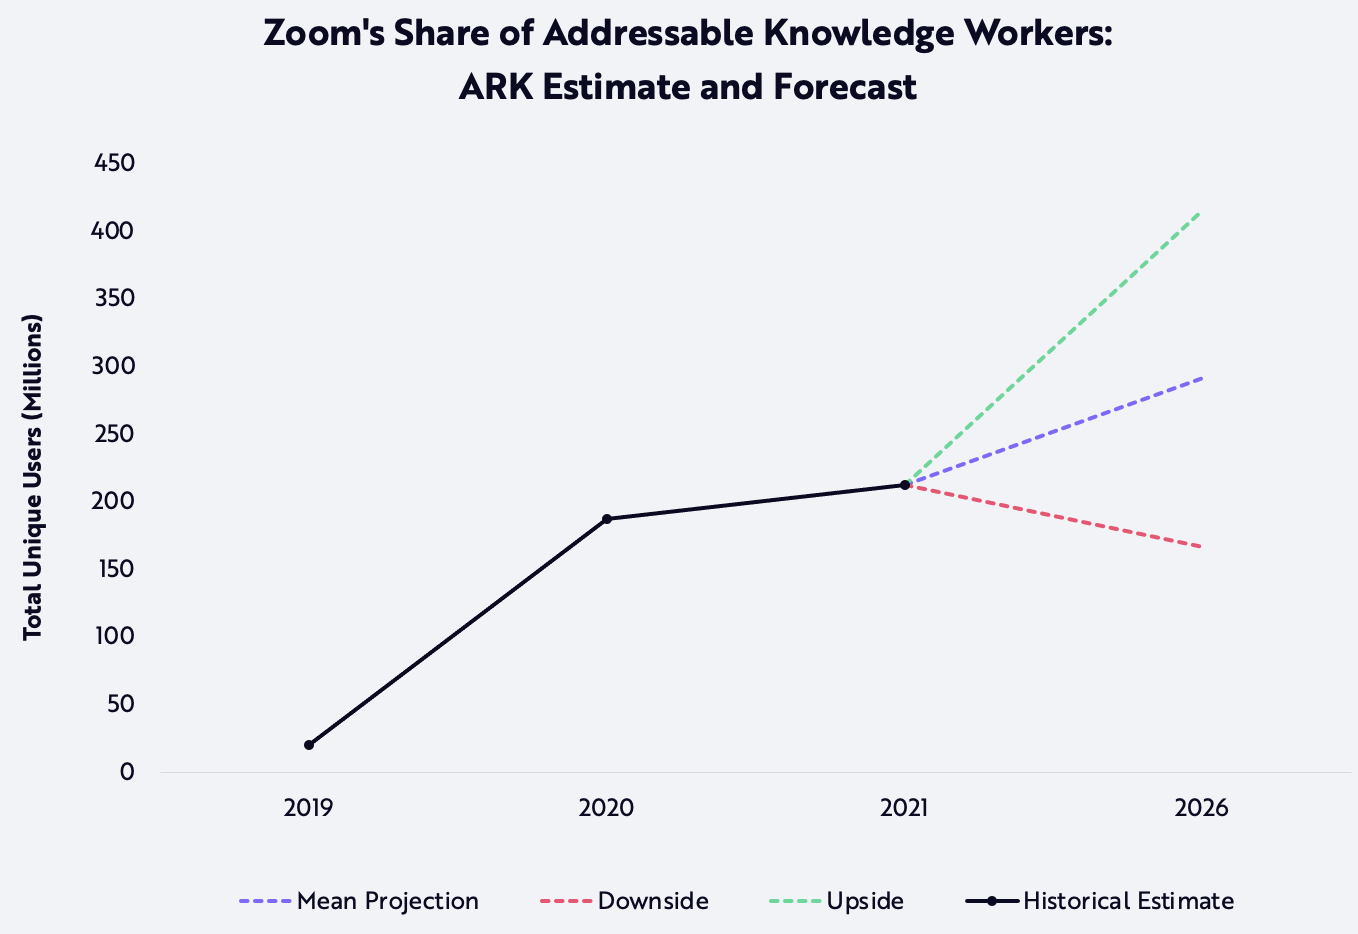
Using Similarweb’s estimates for total unique Zoom users from 2019 to 2021, our model estimates that Zoom’s market penetration increased from 8% in 2019 to 45% during the onset of the pandemic in 2020, and then slipped back to 43% during the reopening in 2021.[11] Our mean projection is that Zoom will continue to lose share linearly, approximately one percentage point per year to 35% in 2026––a forecast that incorporates current competitive dynamics across communication, collaboration, and productivity software providers.
In the chart below, we detail our base, downside, and upside projections for total unique Zoom users. In our mean projection, we expect the number to increase 7% at a compound annual rate from 212 million––or 43% of the current addressable market––to 291 million––or 35% of the total addressable market––by 2026. In our downside projection, we expect total unique users to decrease 5% at an annual rate to 166 million––or 20% of the total addressable market. Finally, in our upside projection, we expect total unique users to increase 14% at an annual rate to 416 million––or 50% of the total addressable market.
Source: ARK Investment Management LLC, 2022; Similarweb, LTD (https://www.similarweb.com/)
Forecasts are inherently limited and cannot be relied upon as a basis for making an investment decision and are built on our modeling that reflect our biases and long-term positive view of the company. Please see additional disclosures below on forecasts and hypothetical performance. For informational purposes only and should not be considered investment advice, or a recommendation to buy, sell, or hold any particular security.
Zoom’s Monetization Share of User Base and ARPU
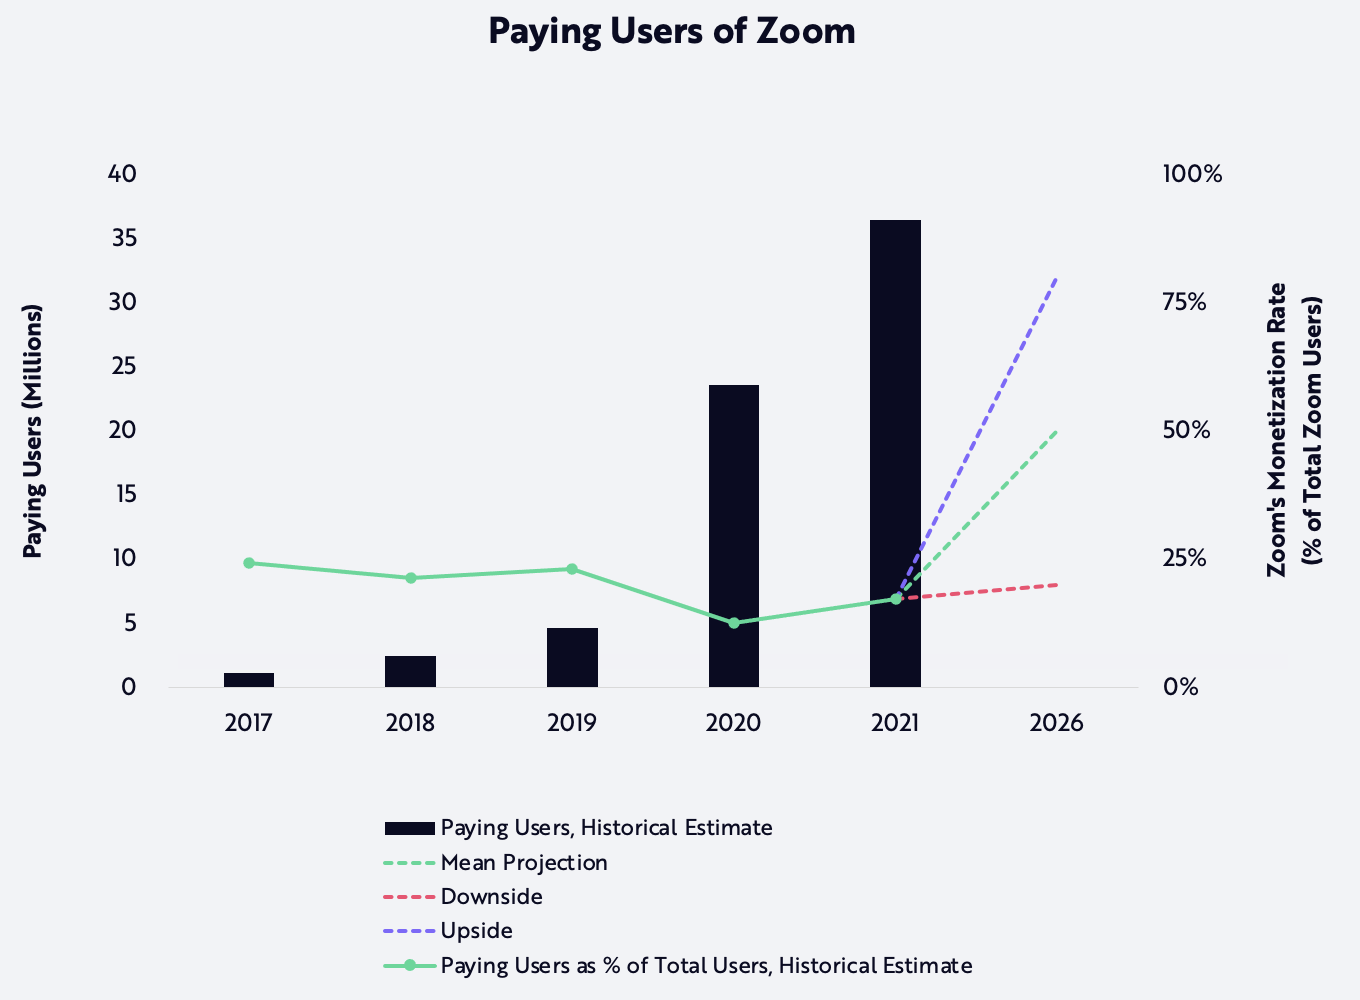
In our view, the most important driver of its business is Zoom’s ability to monetize its users. We estimate past monetization rates by dividing Zoom’s reported annual revenue by our estimate of its average revenue per paying user (ARPU). Zoom Meetings Pro, a plan that offers only video conferencing and chat functionality for up to 100 participants, is its least expensive offering: priced at $180 per year, per license from 2017 to 2019, and then $150 from 2020 to 2021.[12] With Zoom Meetings Pro as an ARPU baseline, we apply an additional 25% discount for enterprise bulk purchases. As shown in the chart below, we estimate that approximately one million people, or 24% of total Zoom users, paid for the service in 2017. Because of the coronavirus crisis, the number of paying Zoom users grew roughly 40-fold to its peak, then settled at 36 million––or 17% of total Zoom users––by the end of 2021.
In our view, these historical ARPU estimates are conservative, pushing our estimate of paying Zoom users to the upper bound. That said, we expect the number of paying users to grow in tandem with the overall growth in the addressable market, particularly if Zoom continues to invest in sales and marketing to increase the share of enterprise in its user base. Our mean projection assumes that the majority of Zoom’s users are enterprise customers, and that 50% of the total Zoom user base is paying by 2026. In other words, by 2026 at least one party in any Zoom call will be a paying user with enhanced Zoom functionality as opposed to all parties with limited and free capabilities. In our downside and upside projections, we expect 20% and 80% of Zoom users to convert to paying users by 2026.
Source: ARK Investment Management LLC, 2022; Similarweb, LTD (https://www.similarweb.com/)
Forecasts are inherently limited and cannot be relied upon as a basis for making an investment decision and are built on our modeling that reflect our biases and long-term positive view of the company. Please see additional disclosures below on forecasts and hypothetical performance. For informational purposes only and should not be considered investment advice, or a recommendation to buy, sell, or hold any particular security.
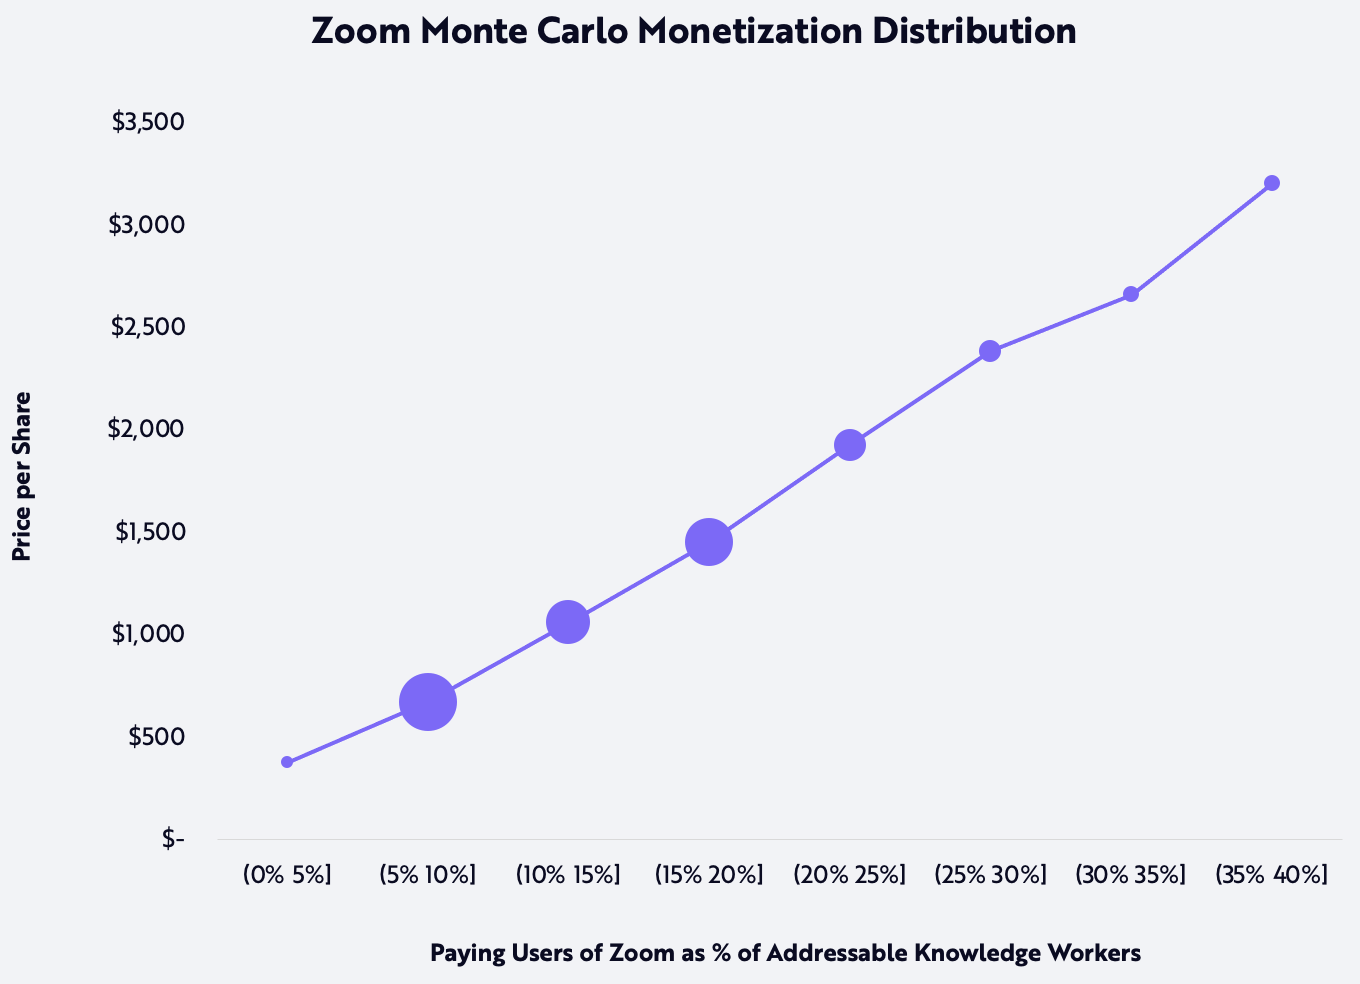
The relationship between Zoom’s monetization rate and our price targets is shown in the chart below. In 5% increments, we plot a potential range of paying Zoom users as a percent of global hybrid/remote knowledge workers against the corresponding average per-share price in our simulations. In the majority of our simulation outcomes, Zoom’s monetized penetration of the addressable market ranges between 5% and 20% in 2026. For perspective, according to our estimates Zoom monetized 7% of the addressable market in 2021.
Source: ARK Investment Management LLC, 2022
Forecasts are inherently limited and cannot be relied upon as a basis for making an investment decision and are built on our modeling that reflect our biases and long-term positive view of the company. Please see additional disclosures below on forecasts and hypothetical performance. For informational purposes only and should not be considered investment advice, or a recommendation to buy, sell, or hold any particular security. Note: The circles shown in the chart above correspond to each of the 5% buckets of paying Zoom users as a percentage of global hybrid/remote knowledge workers, excluding mainland China. Their size variation indicates each bucket’s proportion of our 10,000 Monte Carlo simulations.
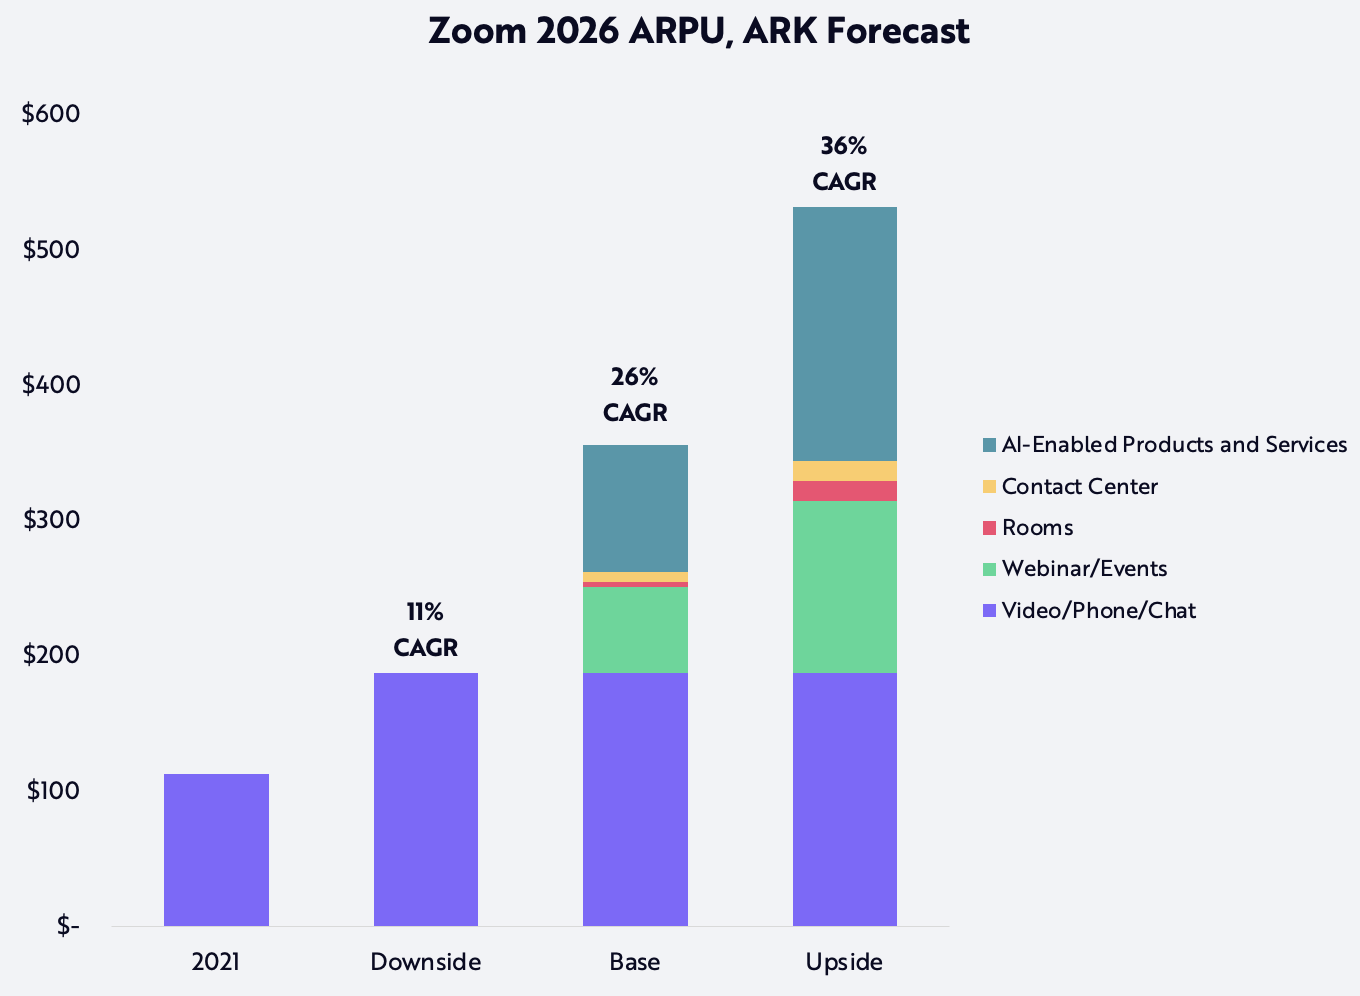
Two major contributors to our 2026 ARPU forecast are (1) Zoom’s core video conferencing, phone, and chat offering and (2) Zoom’s future suite of AI-enabled products and services. In all three price-target cases, we expect the average spending per paying user of Zoom’s video conferencing product to increase from $113 today to $188 in 2026, derived from the current cost of Zoom’s least expensive bundled offering, Zoom United Pro, and an enterprise discount of 25%. As enterprises continue to rip-and-replace legacy communications systems like on-premises phone and video, we expect that customers of Zoom’s core products will switch from video conferencing-only to a bundled solution containing video conferencing, phone, and chat. Similarly, we expect Zoom to land new customers who will pay for “Zoom United” instead of purchasing core products separately. In our downside projection, paying users will purchase only the basic bundled product, still pushing ARPU up at an 11% annual rate from $113 in 2021 to $188 in 2026.
In April 2022, Zoom announced the release of Zoom IQ, analytics powered by conversational AI which, as of now, is targeted only at sales teams.[13] Along with audio and/or video communications, AI-powered analytics should increase productivity across knowledge workers substantially. In our mean projection, the average paying user will spend $94, or 50% of the total cost of Zoom’s core products, on Zoom IQ and AI-related products and services. In our upside projection, the average paying user will spend $188, or 100% of the total cost of Zoom’s core products, on those services. In other words, Zoom IQ and future AI-related products and services represent 26% and 35% of forecasted ARPU in our mean projection and upside projection, respectively, in 2026.
Further, organizations might rely increasingly on cloud-based streaming solutions like Zoom’s Webinar and Zoom Events to support their online-only and online-optional large-scale events. Both services provide high audiovisual quality and availability and should become dominant and trusted solutions.[14] In our mean and upside projections, we estimate that, for every 1,000 and 500 knowledge workers using Zoom, the average enterprise will pay for one Zoom Events license for up to 10,000 participants. In our mean projection, Zoom’s webinar and events solution adds $63 to ARPU, or 18% of total ARPU. In our upside projection, the solution adds $127 to ARPU, or 24% of total ARPU.
Because of limited public disclosures from Zoom and third-party data, we assume conservatively that the impact of Zoom Rooms and Zoom’s new contact center solution will not be significant,[15] [16] though in our mean and upside projections we expect them to contribute $11 and $30 to ARPU, respectively, representing 3% and 6% of total ARPU in each case.
Based on our forecasts for the business lines shown below, ARPU is likely to increase 26% at an annual rate during the next five years, from $113 per year in 2021 to $356 in 2026. In our upside projection, we expect ARPU to grow 36% at an annual rate to $532 per paying user.
Source: ARK Investment Management LLC, 2022
Forecasts are inherently limited and cannot be relied upon as a basis for making an investment decision and are built on our modeling that reflect our biases and long-term positive view of the company. Please see additional disclosures below on forecasts and hypothetical performance. For informational purposes only and should not be considered investment advice, or a recommendation to buy, sell, or hold any particular security.
Model Assumptions That Are Not Key Drivers Of Our Zoom Price Estimate
Adjusted Gross Margin
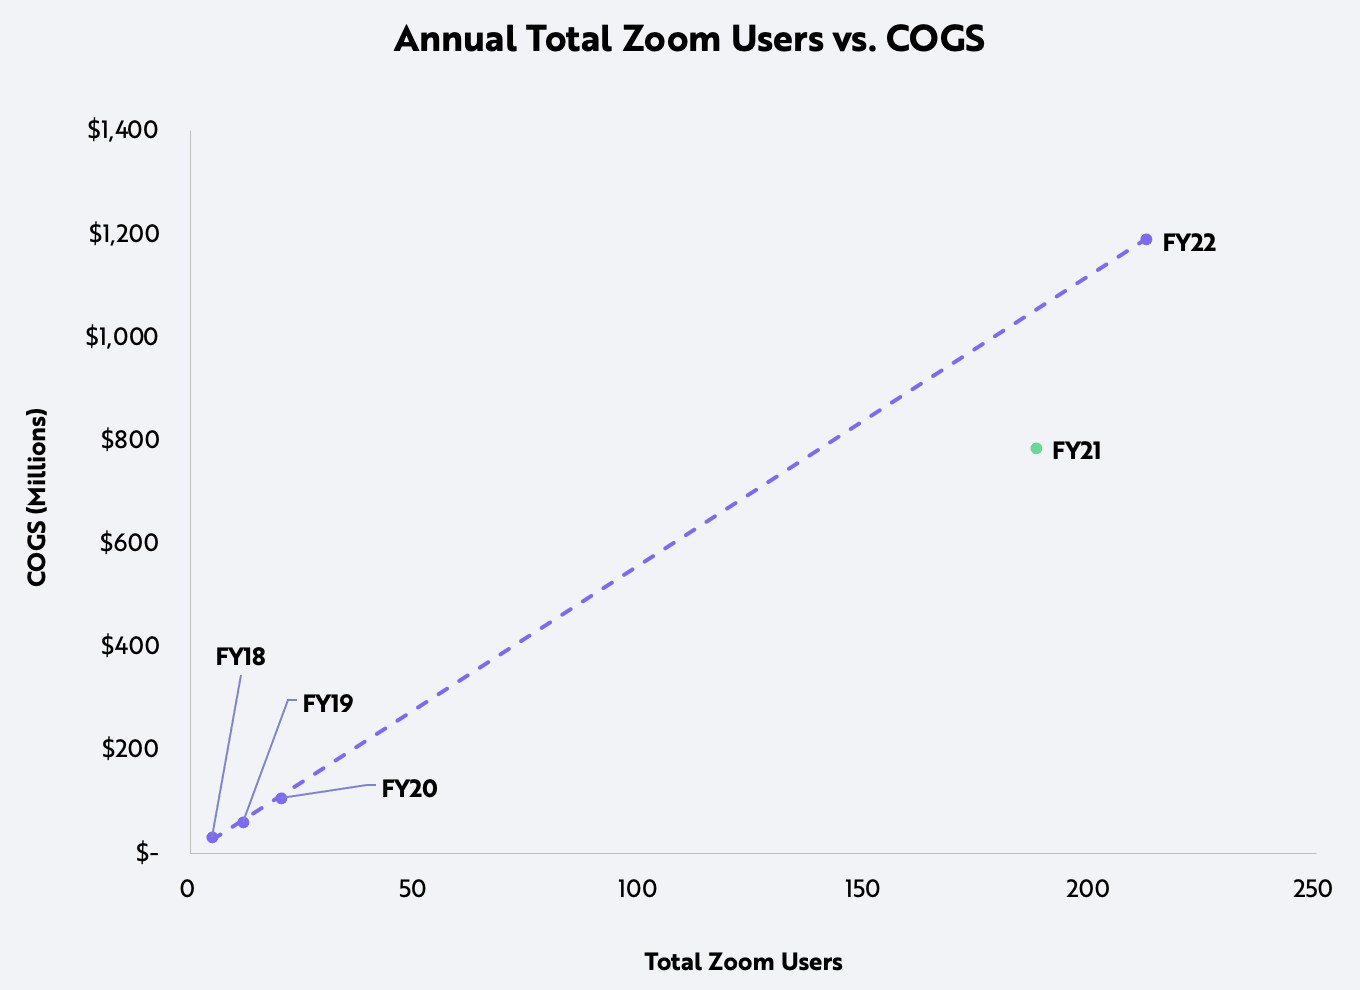
To grasp the relationship between Zoom’s gross margins and total Zoom users historically, we plotted the relationship between Zoom’s historical adjusted cost of goods sold (COGS), adding back the COGS-related stock-based compensation expense, against total Zoom users, as shown below. We fit the datapoints to a linear trendline from 2017 to 2021, or fiscal years 2018 to 2022, excluding a point in fiscal year 2021 that seems to have been an outlier related to atypical growth during the early months of the COVID-19 pandemic. We then incorporated our forecast for total Zoom users in 2026 into the trendline to produce the COGS forecast. That said, as Zoom scales, a linear relationship between the two variables might not hold: the trendline outputs become too aggressive and result in an unlikely scenario in which Zoom grows without investing incremental capital back into COGS.
Source: ARK Investment Management LLC, 2022
Forecasts are inherently limited and cannot be relied upon as a basis for making an investment decision and are built on our modeling that reflect our biases and long-term positive view of the company. Please see additional disclosures below on forecasts and hypothetical performance. For informational purposes only and should not be considered investment advice, or a recommendation to buy, sell, or hold any particular security.
To avoid that unlikely scenario, we modeled the trendline as the minimum COGS relative to a maximum adjusted gross margin. We then treated the difference in maximum adjusted gross margins between years as the source of additional reinvestment in Zoom’s technology stack. In our mean projection, we assumed that 30% of the annual percentage point differential, which averages five percentage points per year from 2022 to 2026, will be reinvested into COGS, implying an adjusted gross margin in the range of 87% and 89%. We see the gross margin forecast as conservative, in line with Zoom’s pre-COVID gross margin expansion.

Source: ARK Investment Management LLC, 2022.
Forecasts are inherently limited and cannot be relied upon as a basis for making an investment decision and are built on our modeling that reflect our biases and long-term positive view of the company. Please see additional disclosures below on forecasts and hypothetical performance. For informational purposes only and should not be considered investment advice, or a recommendation to buy, sell, or hold any particular security.
The gross margins of software companies with $750 million or more in revenue suggest that this gross margin assumption is not out of line, as shown below. In our view, Zoom’s adjusted gross margin will improve from 71% last year to nearly 90% in the next five years for two reasons: first, economies of scale in a software-only business model and, second, paying enterprise customers supplanting Zoom’s free user base.
| Gross Margin | ||
|---|---|---|
| Company | Latest Fiscal Quarter | Latest Fiscal Year |
| The Sage Group PLC | 94% | 93% |
| ANSYS Inc | 92% | 90% |
| Autodesk Inc | 92% | 92% |
| Dolby Laboratories Inc | 91% | 90% |
| Cadence Design Systems Inc | 89% | 90% |
| Adobe Inc | 88% | 88% |
| Check Point Software Technologies Ltd | 88% | 89% |
| Paycom Software Inc | 87% | 87% |
| UiPath Inc | 86% | 81% |
| NortonLifeLock | 85% | 86% |
Source: ARK Investment Management LLC, 2022, S&P Global Inc.
For informational purposes only and should not be considered investment advice, or a recommendation to buy, sell, or hold any particular security.
Adjusted EBITDA Margin And Adjusted Unlevered FCF Margin
Based on healthy operations during the next five years, we believe that Zoom will reach an adjusted EBITDA margin approximating half its gross margin.[17] During 2020 and 2021, Zoom’s adjusted EBITDA margins were 37% and 38%, respectively, more than half the 53% and 54% adjusted gross margins in those years. Moreover, its $5.3 billion in net cash as of 2022 fiscal year end is unlikely to pose a material constraint on Zoom’s growth.
According to our research, Zoom’s adjusted unlevered free cash flow (FCF) margins were 57% and 35%, respectively, during 2020 and 2021, based on adjusted gross margins of 81% and 50%. In our view, Zoom will deliver adjusted unlevered free cash flow (FCF) margins at ~60% of its adjusted gross margins during the next five years.[18]
EV / EBITDA Multiple
To forecast its valuation in 2026, we assume that Zoom’s EV/EBITDA multiple will approximate 20x across all scenarios. Based on the top software-centric technology companies, we believe that our 20x multiple is reasonable, assuming market valuation of technology companies normalizes within the next five years.
| Company | EV / Forward EBITDA [*] | Latest Fiscal Year Revenue [**] |
|---|---|---|
| Microsoft Corporation | 18.3x | 168,088 |
| Oracle Corporation | 11.3x | 40,479 |
| SAP SE | 11.8x | 31,664 |
| Salesforce Inc | 19.3x | 26,492 |
| Adobe Inc | 21.6x | 15,785 |
| VMware Inc | 12.8x | 12,851 |
| Intuit Inc | 21.5x | 9,633 |
| NCR Corporation | 7.1x | 7,156 |
| ServiceNow Inc | 38.1x | 5,896 |
| Dassault Systèmes SE | 24.0x | 5,527 |
| Workday Inc | 23.5x | 5,139 |
| Constellation Software Inc | 17.4x | 5,106 |
| SS&C Technologies Holdings Inc | 10.8x | 5,051 |
| Autodesk Inc | 24.3x | 4,386 |
| Mean | 18.7x | |
| Median | 18.8x |
Source: ARK Investment Management LLC, 2022, S&P Global Inc.
*Note: Multiples are as of June 1, 2022, at market close. **Note: Revenues are reported in millions of US dollars. For informational purposes only and should not be considered investment advice, or a recommendation to buy, sell, or hold any particular security.
Share Dilution
Given its significant cash position, we believe Zoom is unlikely to issue new shares outside of predetermined stock-based compensation plans. In our mean forecast, we assume 2.5% share dilution per year, within a band of 3.5% and 1% in our downside and upside projections, respectively.
Business Opportunities Not Included In The Model
We have excluded additional business lines that could be meaningful to Zoom’s business model.
AI-Enabled Productivity Suite
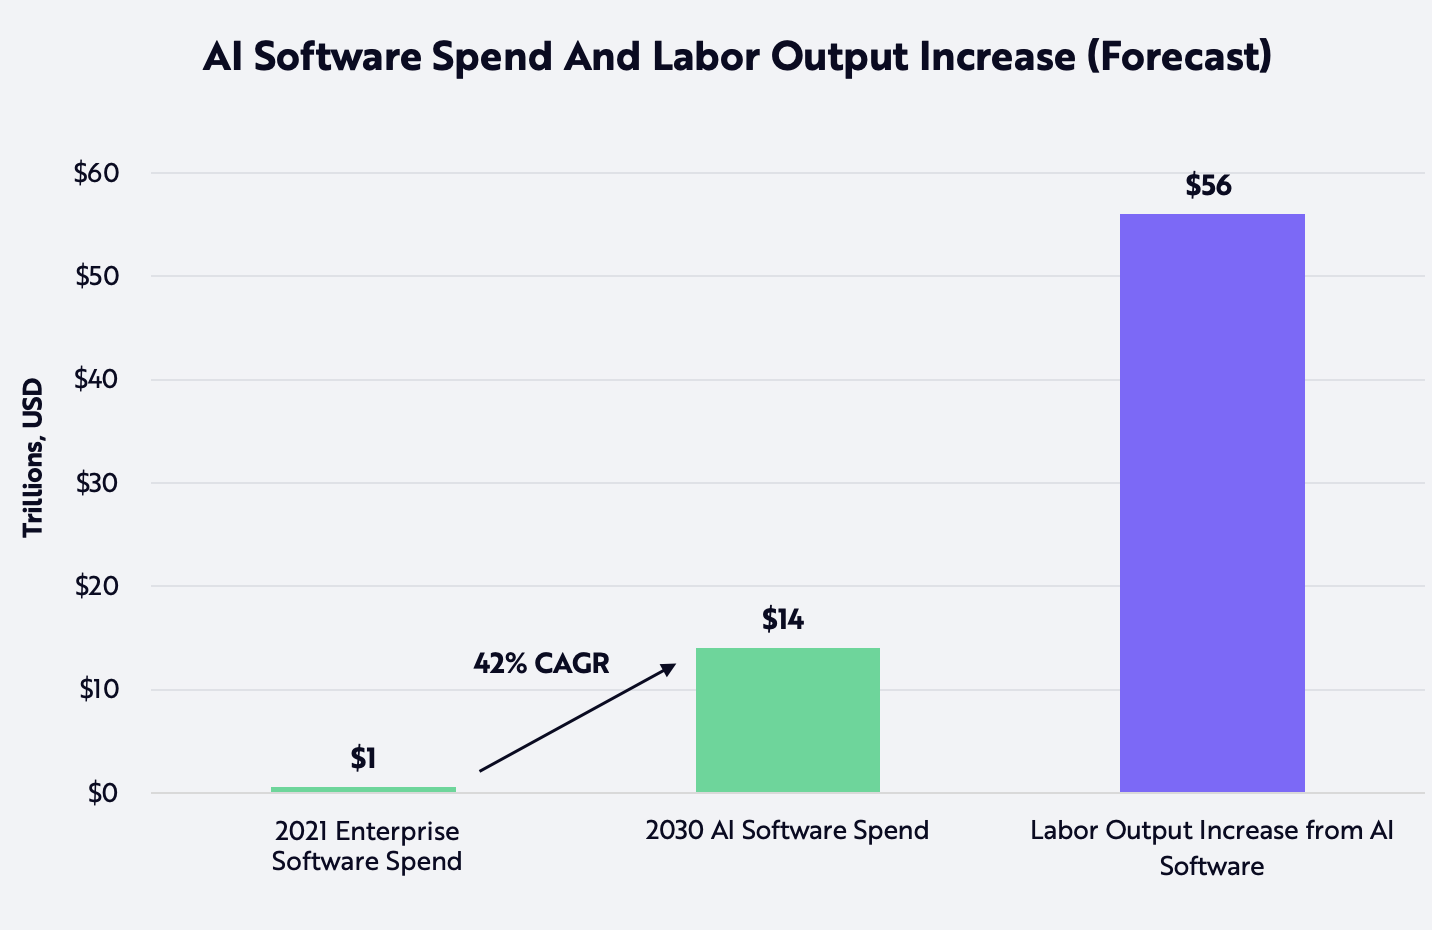
While we incorporate Zoom IQ and future AI-related products and services into our ARPU forecasts, our conservative Zoom model excludes future monetization of AI-enabled tools, from conversational AI analytics and workflow automation to virtual secretaries/assistants. That said, we do believe that AI will boost the growth in industry software spending to 42% at a compound annual rate during the next eight to 10 years, catapulting it from ~$1 trillion in 2021 to ~$14 trillion in 2030, as shown below.
Source: ARK Investment Management LLC, 2022.
Forecasts are inherently limited and cannot be relied upon. | For informational purposes only and should not be considered investment advice, or a recommendation to buy, sell or hold any particular security. Forecast excludes China. Source: ARK Investment Management LLC, 2021 analysis based on company derived statistics and data sourced from the US Bureau of Labor Statistics. “Occupational Employment and Wage Statistics.” www.bls.gov/oes/current/oes_stru.htm., Gartner gartner.com/en/newsroom/press-releases/2021-10-20-gartner-forecasts-worldwide-it-spending-to-exceed-4-trillion-in-2022, and McKinsey Global Institute. “A Future That Works: Automation, Employment, and Productivity.” mckinsey.com/~/media/mckinsey/featured%20insights/digital%20disruption/harnessing%20automation%20for%20a%20future%20that%20works/mgi-a-future-that-works_full-report.pdf
According to ARK’s research, AI could boost knowledge worker productivity by ~33% during the next five years.[19] If the average knowledge worker’s salary were to average $32,000 in 2026 and enterprises were willing to pay them ~25% of the incremental revenue associated with their productivity gains, Zoom’s AI products could boost the knowledge worker’s salary by ~$2,600 (25%*33%*$32,000).[20] With productivity gains from both hybrid/remote communications and AI, Zoom should be well-positioned to monetize its user base. Indeed, our model probably underestimates Zoom’s ARPU growth potential over the next five years.
Conclusion
Based on the analysis presented in this article, ARK’s price target for Zoom is $1,500 per share in 2026. Our bear and bull cases suggest that Zoom could be worth ~$700 and ~$2,000 per share in 2026, respectively.
We have published our open-source model on Github and invite readers to explore, test assumptions, and/or craft visualizations in the simulations. As always, we welcome constructive feedback and criticism.
—
Thoughts or questions about the article? Let us know!
DISCLOSURE
The forecasted performance and price estimates herein are subject to revision by ARK and provided solely as a guide to current expectations. There can be no expectation that the specific security will achieve such performance or that there will be a return of capital. Past performance is not indicative of future results.
FORECASTED PERFORMANCE RESULTS ARE HYPOTHETICAL AND HIGHLY SPECULATIVE, AND PRESENT MANY RISKS AND LIMITATIONS. The recipient should not consider these estimated prices alone in making an investment decision. While ARK believes that there is a sound basis for the forecasts presented, no representations are made as to their accuracy, and there can be no assurance that such forecasts or returns will be achieved by the specific security.
The recipient is urged to use extreme caution when considering the forecasted performance, as it is inherently subjective and reflects ARK’s inherent bias toward higher expected returns. Any higher returns should be viewed as a measure of the relative risk of such investments, with higher forecasted performance generally reflecting greater risk. There is no guarantee that any results will align with the forecasted performance, and they might not be predictive. Some or all results may be substantially lower than projected results and, as with any investment, it is possible that you could lose money.
FORECASTED performance results (single security model simulation forecasts) have many inherent limitations. A recipient account might or might not hold this single security, and the account performance will be affected in proportion to its holding size and the amount of price fluctuation over time. No representation is being made that any client account will or is likely to achieve profits or losses tied to a security in the security model forecasts. In fact, there could be significant differences between these forecasted performance results and the actual results realized.
Forecasted performance has not been achieved by the security, and like all modeled, projected or hypothetical performance, it is important to note that there are multiple versions of a model, and ARK has a conflict of interest in that we have an incentive to show you the best performing results. These forecasts rely on models, which calculate hypothetical performance. Several of the limitations of hypothetical performance models include: 1) reliance on a variety of data obtained from sources that are believed to be reliable, but might be incorrect, inaccurate or incomplete and ARK does not guarantee the accuracy or completeness of any information obtained from any third party, 2) potential inclusion of inherent model creation biases, data discrepancies and/or calculation errors that could cause actual results to differ materially from those projected, 3) NO reflection of the impact that material economic and market factors might have had on investment decisions that would have been in actual portfolios being managed at the time and do not involve market risk, and 4) NO guarantee of future investment results. The forecasted results rely on assumptions, forecasts, estimates, modeling, algorithms and other data input by ARK, some of which relies on third-parties, that could be or prove over time to be incorrect, inaccurate or incomplete.
The forecasted returns are based on a variety of criteria and assumptions, which might vary substantially, and involve significant elements of subjective judgment and analysis that reflect our own expectations and biases, which might prove invalid or change without notice. It is possible that other foreseeable events that were not taken into account could occur. The forecasted performance results contained herein represent the application of the simulation models as currently in effect on the date first written above, and there can be no assurance that the models will remain the same in the future or that an application of the current models in the future will produce similar results because the relevant market and economic conditions that prevailed during the performance period will not necessarily occur. The results will not be updated as the models change, or any information upon which they rely changes. There are numerous other factors related to the markets in general or to the public equity security specifically that cannot be fully accounted for in the preparation of forecasted performance results, all of which can adversely affect actual results. For these reasons, forecasted performance results will differ, and could differ significantly from actual results. FORECASTED PERFORMANCE RESULTS ARE SUBJECT TO REVISION AND PRESENTED FOR ILLUSTRATIVE PURPOSES ONLY.
While ARK’s current assessment of the subject company may be positive, please note that it might be necessary for ARK to liquidate or reduce position sizes prior to the company attaining any forecasted valuation pricing due to a variety of conditions including, but not limited to, client specific guidelines, changing market conditions, investor activity, fundamental changes in the company’s business model and competitive landscape, headline risk, and government/regulatory activity. Additionally, ARK does not have investment banking, consulting, or any type of fee-paying relationship with the subject company.
Related Research

Google's Driverless Car: A Massive Data Request

A Different Interpretation of Recent Market Signals